
Page 25 - On The Move - Volume 17, Issue 3
P. 25
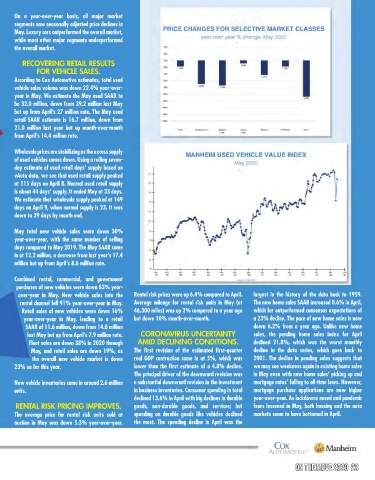
On a year-over-year basis, all major market
      segments saw seasonally adjusted price declines in
      May. Luxury cars outperformed the overall market,
      while most other major segments underperformed
      the overall market.

        RECOVERING RETAIL RESULTS
             FOR VEHICLE SALES.
      According to Cox Automotive estimates, total used
      vehicle sales volume was down 22.4% year-over-
      year in May. We estimate the May used SAAR to
      be 32.0 million, down from 39.2 million last May
      but up from April’s 27 million rate. The May used
      retail SAAR estimate is 16.7 million, down from
      21.0 million last year but up month-over-month
      from April’s 14.4 million rate.

      Wholesale prices are stabilizing as the excess supply
      of used vehicles comes down. Using a rolling seven-
      day estimate of used retail days’ supply based on
      vAuto data, we see that used retail supply peaked
      at 115 days on April 8. Normal used retail supply
      is about 44 days’ supply. It ended May at 33 days.
      We estimate that wholesale supply peaked at 149
      days on April 9, when normal supply is 23. It was
      down to 39 days by month end.

      May total new vehicle sales were down 30%
      year-over-year, with the same number of selling
      days compared to May 2019. The May SAAR came
      in at 12.2 million, a decrease from last year’s 17.4
      million but up from April’s 8.6 million rate.

      Combined rental, commercial, and government
      purchases of new vehicles were down 83% year-
       over-year in May. New vehicle sales into the   Rental risk prices were up 6.4% compared to April.   largest in the history of the data back to 1959.
        rental channel fell 91% year-over-year in May.   Average mileage for rental risk units in May (at   The new home sales SAAR increased 0.6% in April,
        Retail sales of new vehicles were down 16%   46,300 miles) was up 2% compared to a year ago   which far outperformed consensus expectations of
         year-over-year in May, leading to a retail   but down 10% month-over-month.     a 23% decline. The pace of new home sales is now
         SAAR of 11.6 million, down from 14.0 million                               down 6.2% from a year ago. Unlike new home
          last May but up from April’s 7.9 million rate.   CORONAVIRUS UNCERTAINTY    sales, the pending home sales index for April
           Fleet sales are down 38% in 2020 through   AMID DECLINING CONDITIONS.    declined 21.8%, which was the worst monthly
           May, and retail sales are down 19%, as   The first revision  of the estimated  first-quarter   decline in the data series, which goes back to
            the  overall  new  vehicle market  is  down   real GDP contraction came in at 5%, which was   2001. The decline in pending sales suggests that
      23% so far this year.                  lower than the first estimate of a 4.8% decline.   we may see weakness again in existing home sales
                                             The principal driver of the downward revision was   in May even with new home sales’ picking up and
      New vehicle inventories came in around 2.6 million   a substantial downward revision in the investment   mortgage rates’ falling to all-time lows. However,
      units.                                 in business inventories. Consumer spending in total   mortgage  purchase  applications  are  now  higher
                                             declined 13.6% in April with big declines in durable   year-over-year. As lockdowns eased and pandemic
      RENTAL RISK PRICING IMPROVES.          goods, non-durable goods, and services; but   fears lessened in May, both housing and the auto
      The average price for rental risk units sold at   spending on durable goods like vehicles declined   markets seem to have bottomed in April.
      auction in May was down 5.3% year-over-year.   the most. The spending decline in April was the


                                                                                                   On The Move 2020  23ve 2020  23
                                                                                                   On The Mo